Customer Churn Predictor

An accurate predictor for companies

What is Customer Churn Prediction?

One of the most important applications of data science in the commercial sector is churn prediction. Its popularity stems from the fact that its impacts are more tangible to comprehend, and it plays a significant role in the company's overall revenues.

Churn is described as "when a client cancels a subscription to a service they have been utilizing" in business terms. People cancelling Spotify/Netflix memberships are a regular example. So, based on their utilization of the service, Churn Prediction is effectively projecting which clients are most likely to cancel a subscription, i.e. 'leave a company.'.

From a business standpoint, obtaining this information is critical because recruiting new clients is generally more difficult and costly than retaining existing customers. As a result, the information acquired through Churn Prediction allows them to focus more on the customers who are most likely to leave.

Goals

  • 1). What features are significant in prediction the churn in a customer.

  • 2). To suggest measure in order to improve the retention rate with respect to customer category.


The Process

Data Exploration

Following we needed to train our data. This was accomplished by using 80% of the data for training and the other 20% for testing.


Machine Learning Model Training

We first had to find a data set that fit our specifications. Once we had done that we needed to clean the data set up by removing columns and converting some of the data.


Aid the Companies

Following that we needed to train our data. This was accomplished by using 80% of the data for training and 20% for testing. As a result we were able to get accurate results.

Tech Stack

This section explains the technologies required to produce our product.

Website Development

For the development of this website, we used HTML, JavaScript, CSS, Github, Bootstrap and Flask Framework. All of these tools played crucial roles in making development fast and easy.

Collaborative Workspace

Speaking of crucial roles, Cocalc, Zoom, and Discord, were some of the most crucial technologies in this stack. Without these tools, it would've been extremely hard to collaborate both when coding and when communicating.

Data Analysis

For our Data Analysis we used: Seaborn, Pyhton, Plotly, Pandas, Numpy, and Matplotlib. While you may only see Plotly graphs on the website, we used a plethora of other libraries to understand the data before creating interactive plotly graphs with the knowledge we had from our EDA.

Machine Learning

Finally, for the machine learning portion of our project, we used Sklearn, Xgboost, SVC, Random Forests, Decision Trees, and many other models. The purpose of using so many was to ensure we gave the most accurate results.

EDA

EDA which stands for exploratory data analysis is one of the most important steps in the field of data science. While it allows a data scientist to understand their data better, it's also important in the machine learning process, as it allows a data scientist to find which variables are most important or find which variables can be removed to clean the dataset.

  • Exited : The target variable
  • Credit Score : What the customers credit score is
  • Gender : The customers gender
  • Geography : What country the customer lives in
  • Age : The age of the customer
  • Estimated Salary : The estimated salary of the customer
  • Is Active Member : If the customer is an active member or not
  • Has Credit Card : Whether the customer has a credit card or not
  • Number of Products : How many products the customer bought
  • Balance : The customers balance
  • Tenure : How many years the customer has stayed with the company


  • Correlation Heat Map

    First thing our group did in our EDA notebook, was create a correlation heatmap so we could better understand which variables to focus on and the dataset as a whole.

  • Here we created a scatter plot to show the correlations between 3 different variables. On our Correlation Heat Map these three items had the highest correlation.

  • This pie chart shows the amount of exited to non-exited customers. Exited is in red while non-exited is in purple.

  • Here from a few of these countplots you can see simple comparisons between two categories. From this you can see how our data compares to each other.

Modeling

Machine Learning Recall Rates:

Over the course of our customer churn analysis we used machine learning to see if the customer would stay with the bank, or leave. Through the use of Support Vector Classification (SVM) we have gotten the highest recall value to ensure that you get the most accurate result.

SVM 93%
Random Forest 90%
Decision Tree 73%
XG Boost 65%

Services

Here we are working on creating a product that can help both large and small companies. We want to help YOU to achieve your full potential. We want your company to succeed and that will be made possible with our customer churn data. Bellow you will see our different services for you to be able to better pick which one you would like to use.

Support Vector Classification

Support Vector Classification makes sure that you succeed by having the highest recall rate. To put into laymen terms Support Vector Classification is a very smart machine that uses these classification algorithms to get you the most reliable data. Since this had the highest success rate (93%) it is also our most expensive yet most reliable option. This is recommended for large companies that use subscription service and online services.

Random Forest

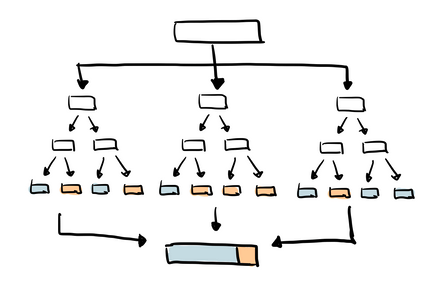
Random Forest is another powerful machine learning model that uses multiple decision trees from the Decision Tree model to predict an outcome. Since this is our second best product it is also our one of our second most reliable model (90%) and is recommended for subscription based companies.

Decision Tree

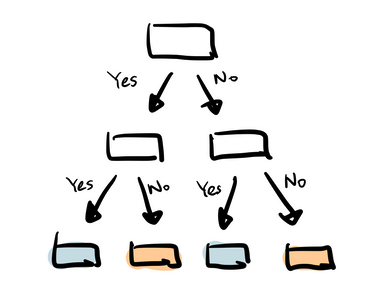
Decision Trees are a bunch of true or false statements that rely on classification questions. This product should be used by small to medium companies that use online services and want to cater ads to a certain demographic. Since this machine was given our third highest success rate certification this is also our base option.

XG Boosting

XG Boosting is gradient boosted Decision trees. This was one of our lowest success rate of the four and as a result we recommend this to small companies that want to get into online retailing. This way you can try and cater your ads to a demographic that is interested in your product. Since this has the lowest success rate it is also considered our budget option.

Our Machine Learning Models


XG Boost

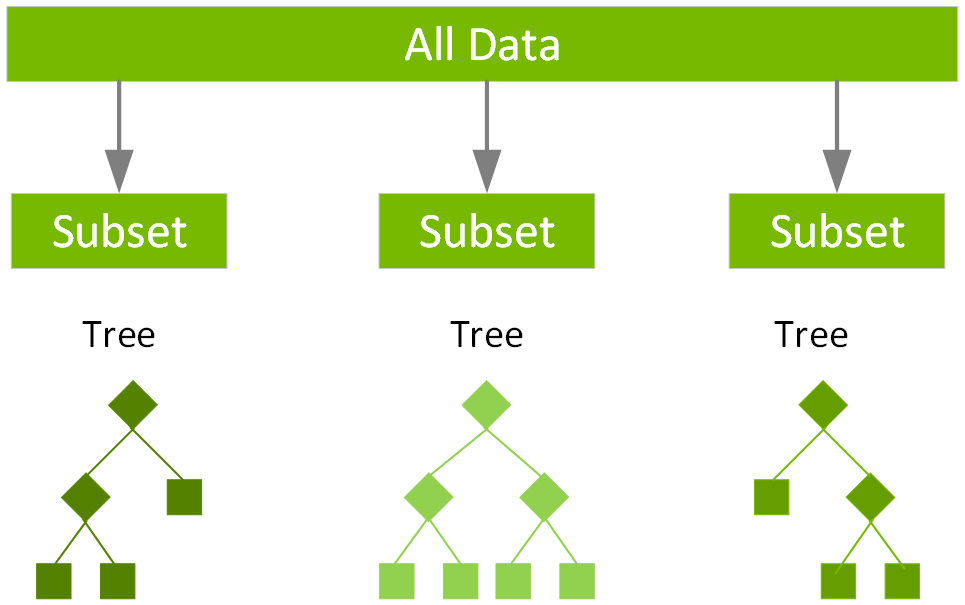
XGBoost is an extension to gradient boosted decision trees (GBM) and specially designed to improve speed and performance. It implements Machine Learning algorithms under the Gradient Boosting framework, and it provides parallel tree boosting to solve many data science problems in a fast and accurate way.


XGBoost Results:

Here we have a confusion matrix with the results of the linear regression applied on our testing dataset. A confusion matrix for a classification problem tells us the number of correct and incorrect predictions for every class(Exited or Non- Exited). XgBoost performed well on the dataset.


Random Forest Classifier

We use Random Forest Classification in order to address the issue of 'over-fitting' that a single tree may exhibit; so by using multiple decision trees it's able to vote on the most common classification. Random forest uses a technique called bagging to build full decision trees in parallel from random bootstrap samples of the data set. The final prediction is an average of all of the decision tree predictions. They're generally more accurate than single decision trees, but also more memory-consuming.


Random Forest Results:

Here is the confusion matrix that shows the results from Random Forest Classifier. This matrix had a lower correlation than the other models.


Decision Tree Classifier

Decision Tree Classifier builds branches of if-else statements in a hierarchy, and develops the data by dividing it based on the data's most important features, which makes it simpler and easier to understand, but sometimes decision trees can contain algorithms that become too complex to calculate.


Decision Tree Results:

Here is the confusion matrix that shows the results from Decision Tree Classifier, and this matrix performed slightly better than the Random Forest confusion matrix, but had about the same performance as Support Vector Classifier.


Support Vector Classifier

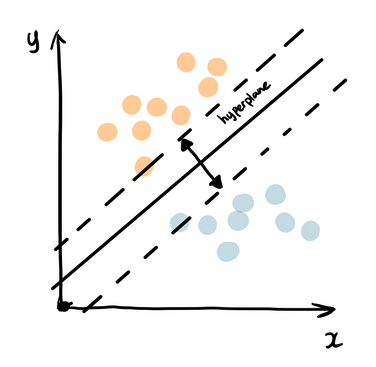
Support Vector Classifier uses an algorithm that splits the data given apart on a border called the hyperplane, separating the data into classes, which can make it capture complex relationship between certain features in our data.


SVM Results:

Here is the confusion matrix that shows the results from the Support Vector Classifier, and this matrix's performance was subpar in this dataset.

Conclusion

In conclusion, focusing more on the recall, SVM clearly performed the best on our dataset for predicting If customer is going to churn or not. In terms of important features, we used all the features In the correlation map, we didn't saw any specific feature with high correlation with the target variable or multi-collinearity in the data. There could be multiple reason of churn in a customer like leaving to the competitor, missing functionality, Poor customer fit, etc. If possible we can explore more and add the data where we could find the reason of the churn and then perform Descriptive Data Analysis for more information and insights about the customers in an organization.


So what?

Our product can help companies to understand what should they improve, to get more customers. It can help to make better commercials, based for example on region, or on preferences in the certain areas. Overall, our product is targeted on improving interest of people to the certain business.

Team

Our team members who worked on the project.

Keshav Likhar

Mentor of the Recursive Searchers Team

Social Media

Aedan Bingham

AI Camp Student.

Social Media

Aakriti Mishra

AI Camp Student

Social Media

Matthew Guerra

AI camp student.

Social Media

Eric Baber

Ai Camp Student.

Social Media

Yoonchul Shin

AI Camp Student.

Social Media

Gleb Miroshnikov

AI Camp Student.

Social Media

Contact

Location:

2627 Hanover Street, Palo Alto, CA 94304

Call:

+(650) 436-4477

Loading
Your message has been sent. Thank you!